 English
Estimate at completion (EAC) is what a job will cost when it is finished. Estimate to complete (ETC) is what it will cost from today. They are simple ideas with four standard formulas – and the formulas can give answers more than £80,000 apart on the same job. This guide explains each method, works all four on one example, and shows why contractors should treat formula EACs as a check on a bottom-up forecast rather than the other way round.
EAC and ETC in one minute
EAC = AC + ETC: actual cost to date plus the estimate to complete. Budget at completion (BAC) is the budget; variance at completion (VAC) = BAC − EAC. Cost to complete is often used for ETC in construction. In earned value management, earned value (EV) is the budgeted cost of the work actually done, and the cost performance index CPI = EV ÷ AC.
The four standard formulas
| Formula | Assumes | EAC in the example | VAC |
|---|---|---|---|
| EAC = BAC ÷ CPI | Cost performance so far continues | £593,469 | −£89,269 |
| EAC = AC + (BAC − EV) | Overrun so far is a one-off | £561,332 | −£57,132 |
| EAC = AC + (BAC − EV) ÷ (CPI × SPI) | Cost and schedule both drive the rest | £613,498 | −£109,298 |
| EAC = AC + bottom-up ETC | Remaining cost is known from orders and plans | £527,980 | −£23,780 |
The first three are formula-based independent EACs from earned value. US Department of Energy guidance is clear that a contractor’s EAC should be estimate-based, with formula EACs used as a reasonableness check – if the to-complete performance index differs from CPI by more than 0.05, the EAC is suspect.
Worked example: four answers on one job
Take a £560,000 HVAC fit-out at the end of October. BAC is £504,200 (original budget plus CO-03), AC is £379,820. The project manager judges physical progress at 64%, so EV = £322,688 and CPI = 0.85.
The fourth formula needs a schedule measure. The example job has no detailed earned value schedule, so we add an illustrative assumption: the baseline programme had 70% of the work done by the end of October. Planned value is then PV = 0.70 × BAC = £352,940, and SPI = EV ÷ PV = 0.91. The result depends entirely on that assumption.
The CPI × SPI method says £613,498 and the CPI method £593,469, respectively about £85,518 and £65,489 worse than the bottom-up forecast of £527,980. CPI × SPI is usually the most pessimistic of the formulas, because it assumes being behind programme will also cost money; that may be true for preliminaries and supervision, and much less so for materials. The bottom-up figure is built from actual cost, open purchase orders and subcontracts, and the remaining hours the project manager expects – it is the figure on the job cost report.
Why CPI misleads on equipment-heavy jobs
CPI assumes the cost efficiency of work done so far applies to the rest. On this job that is not true for two reasons. First, the air handling units (£162,800, a third of the budget) were bought early and installed; they are almost all of the “materials” cost and they came in on budget. Second, physical progress of 64% is the project manager’s view of the installation work, which lags the equipment. Blending a front-loaded purchase into a labour-led progress measure produces a low CPI, and dividing BAC by it inflates EAC. The reverse is also common: front-loaded earned value plans inflate CPI and hide overruns until late in the job, as Humphreys & Associates have shown. Either way, the formula is only as good as the progress measure.
Cost-to-cost progress – actual divided by forecast cost, 71.9% here – is what revenue recognition uses (see our job costing guide). It is consistent with the bottom-up EAC by construction, which is also its weakness: if the forecast is wrong, progress is wrong too.
Bottom-up ETC, per cost code
Bottom-up ETC is built line by line: for each cost code, committed cost (open POs and subcontracts) plus remaining quantities or hours at current rates. Labour is where most of the judgement sits. Here installation has used 1,420 of 1,750 estimated hours, and the project manager expects 600 more – an overrun of 270 hours at £42. If the trend of the last three months continues, it could be more; that is the question to ask at every review.
| Cost code | Current budget | Actual to date | Committed | Still to buy / do | Forecast | Variance to current | |
|---|---|---|---|---|---|---|---|
| 110 | Air handling units and fans | £165,000 | £162,800 | £0 | £0 | £162,800 | +£2,200 |
| 120 | Ductwork and fittings | £126,600 | £80,000 | £30,000 | £21,000 | £131,000 | −£4,400 |
| 130 | Dampers, grilles and fire dampers | £60,300 | £37,000 | £21,500 | £4,300 | £62,800 | −£2,500 |
| 450 | Insulation subcontract | £39,000 | £15,600 | £28,100 | £0 | £43,700 | −£4,700 |
| 490 | Preliminaries | £18,000 | £12,600 | £0 | £6,700 | £19,300 | −£1,300 |
| 510 | Installation labour | £73,500 | £59,640 | £0 | £25,200 | £84,840 | −£11,340 |
| 520 | Project management and engineering | £15,080 | £12,180 | £0 | £4,640 | £16,820 | −£1,740 |
| 530 | Commissioning and handover | £6,720 | £0 | £0 | £6,720 | £6,720 | £0 |
| Total | £504,200 | £379,820 | £79,600 | £68,560 | £527,980 | −£23,780 |
A quick check: TCPI
The to-complete performance index asks how efficient the rest of the work must be to finish on budget: TCPI = (BAC − EV) ÷ (BAC − AC). In the example that is £181,512 ÷ £124,380 = 1.46. With a CPI of 0.85, the team would have to work about 70% more efficiently than so far to land on budget. That is not going to happen, and under DOE’s rule of thumb (TCPI more than 0.05 away from CPI) any EAC close to budget is suspect. In this case the check and the bottom-up forecast agree on direction: the job will finish over budget. They disagree on how much – which is why the progress measure behind EV deserves a hard look.
Forecasting labour: earned hours
For labour-heavy cost codes, a better check than CPI is earned hours: estimated hours for the work actually installed, compared with hours spent. If installation is judged 70% done against 1,750 estimated hours, earned hours are 1,225 against 1,420 actually spent – a productivity factor of 0.86. Applied to the remaining 30% of the work, that suggests about 610 more hours, close to the project manager’s 600. When the two diverge, ask why before you choose a number.
From cost forecast to forecast margin
EAC is about cost. Four different forecast numbers are often mixed up, and it is worth keeping them apart:
| Number | Definition | Example |
|---|---|---|
| Cost EAC | Actual cost + ETC | £527,980 |
| ETC (cost to complete) | Cost still to come = EAC − actual | £148,160 |
| Forecast revenue | Contract value + approved change orders | £571,200 |
| Forecast profit and margin | Forecast revenue − cost EAC | £43,220 (7.6%) |
Pending changes should be shown separately, not mixed into forecast revenue. With CO-04 agreed, forecast profit would be £57,220 (9.8%).
How often to update
Monthly as a minimum, with the WIP schedule. Weekly for labour hours on jobs where labour is the main risk. And immediately when something big changes: a subcontract is let, a change is instructed, a supplier reprices. Record why the EAC moved – a sequence of unexplained small increases is the signature of profit fade.
Forecasting cost to complete and final margin
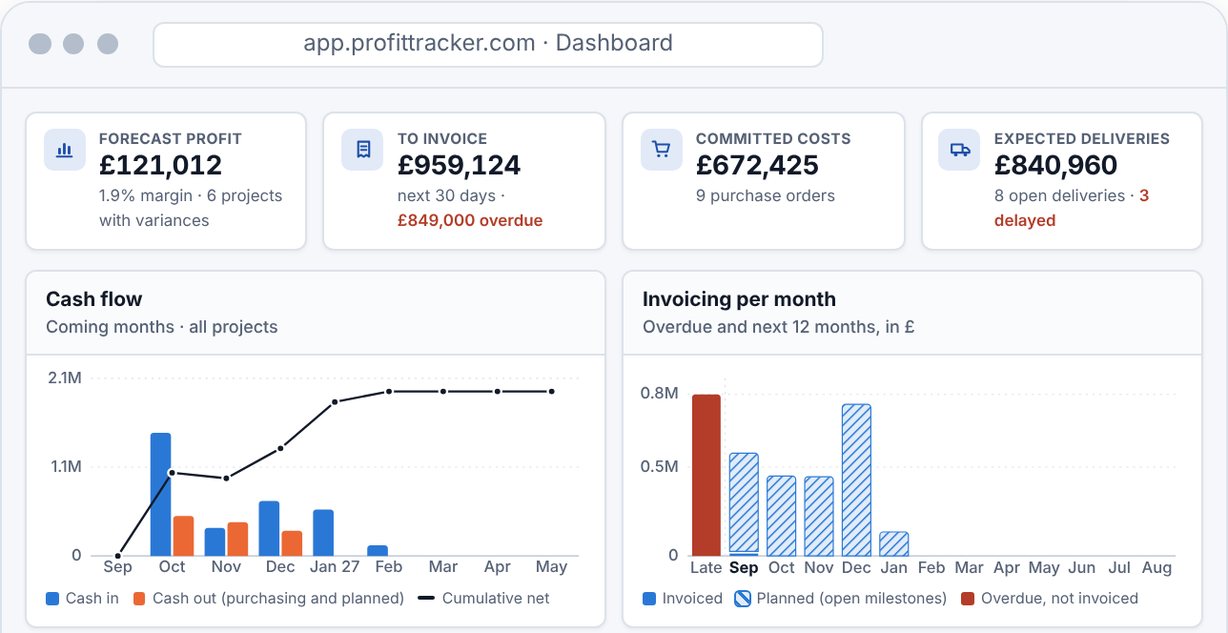
ProfitTracker builds the forecast the bottom-up way: per budget line, planned + committed + incurred = forecast, and forecast margin per job against the target margin from the estimate, with a green, amber or red status. Committed comes from purchase orders, incurred from bills read from the accounting system in the daily sync, and remaining labour from the hours estimate minus hours booked.
It does not calculate earned value, CPI or SPI. Use the formula methods in this guide as a check on the forecast it gives you.
Want to see forecast cost and margin on your own jobs?